Dashboard (Chaos Operator)
The chaos operator dashboard provides a web interface for monitoring chaos experiments, tracking operator resilience over time, and visualizing operator dependency graphs with chaos coverage overlays.
Overview
The dashboard runs as a single Go binary that:
- Watches ChaosExperiment CRs via the Kubernetes API (polling at a configurable interval)
- Persists experiment snapshots to SQLite (WAL mode) for historical queries
- Serves a REST API consumed by the React frontend
- Streams live experiment updates via Server-Sent Events (SSE)
- Embeds the compiled React build as static assets (single binary deployment)
graph TB
    subgraph Cluster["Kubernetes Cluster"]
        API["K8s API Server"]
        CRs["ChaosExperiment CRs"]
        CRs --> API
    end

    subgraph Binary["Dashboard Binary (single Go process)"]
        direction TB
        Watcher["K8s Watcher<br/>(poll interval)"]
        Store["SQLite Store<br/>(WAL mode)"]
        REST["REST API<br/>/api/v1/*"]
        SSE["SSE Stream<br/>/api/v1/experiments/live"]
        Static["Embedded Static Assets<br/>(go:embed)"]

        Watcher --> Store
        Store --> REST
        Store --> SSE
    end

    subgraph Frontend["React Frontend (TypeScript)"]
        Overview["Overview"]
        Experiments["Experiments"]
        Operators["Operators"]
        Knowledge["Knowledge"]
        Live["Live Monitor"]
        Suites["Suites"]
    end

    API -- "list/watch" --> Watcher
    REST -- "JSON" --> Frontend
    SSE -- "events" --> Live
    Static -- "serves" --> Frontend

    KnowledgeDir["knowledge/*.yaml"] -. "loaded at startup" .-> Binary

    style Cluster fill:#e8f0fe,stroke:#4285f4
    style Binary fill:#fef7e0,stroke:#f9ab00
    style Frontend fill:#e6f4ea,stroke:#34a853
Prerequisites
- Go 1.25+
- Node.js 18+ and npm (for building the frontend)
- Kubernetes/OpenShift cluster with ChaosExperiment CRs
kubeconfigwith read access to ChaosExperiment resources
Building
# 1. Build the React frontend
cd dashboard/ui
npm ci
npm run build
cd ../..

# 2. Build the Go binary (embeds the compiled UI)
go build -o bin/chaos-dashboard ./dashboard/cmd/dashboard/
The npm run build step outputs to dashboard/ui-dist/, which is embedded into the Go binary via go:embed.
Running
# Basic usage (in-cluster or with default kubeconfig)
bin/chaos-dashboard

# With all options
bin/chaos-dashboard \
  -addr :8080 \
  -db dashboard.db \
  -kubeconfig ~/.kube/config \
  -knowledge-dir knowledge/ \
  -sync-interval 30s
Then open http://localhost:8080.
Flags
| Flag | Description | Default |
|---|---|---|
-addr |
HTTP listen address | :8080 |
-db |
SQLite database path | dashboard.db |
-kubeconfig |
Path to kubeconfig (uses in-cluster config if empty) | |
-knowledge-dir |
Directory containing operator knowledge YAML files | |
-sync-interval |
How often to poll K8s for ChaosExperiment updates | 30s |
Knowledge Models
The -knowledge-dir flag loads operator knowledge YAML files at startup. These power the Knowledge view's dependency graph and coverage overlays. Without this flag, the Knowledge page will show no data.
The repository ships with knowledge models for 7 operators in the knowledge/ directory:
| Operator | File | Components |
|---|---|---|
| odh-model-controller | odh-model-controller.yaml |
odh-model-controller |
| kserve | kserve.yaml |
kserve-controller-manager, llmisvc-controller-manager, kserve-localmodel-controller-manager, kserve-localmodelnode-agent |
| opendatahub-operator | opendatahub-operator.yaml |
opendatahub-operator |
| dashboard | dashboard.yaml |
odh-dashboard |
| data-science-pipelines | data-science-pipelines.yaml |
data-science-pipelines-operator, ds-pipelines-webhook |
| model-registry | model-registry.yaml |
model-registry-operator |
| workbenches | workbenches.yaml |
odh-notebook-controller, kf-notebook-controller |
Views
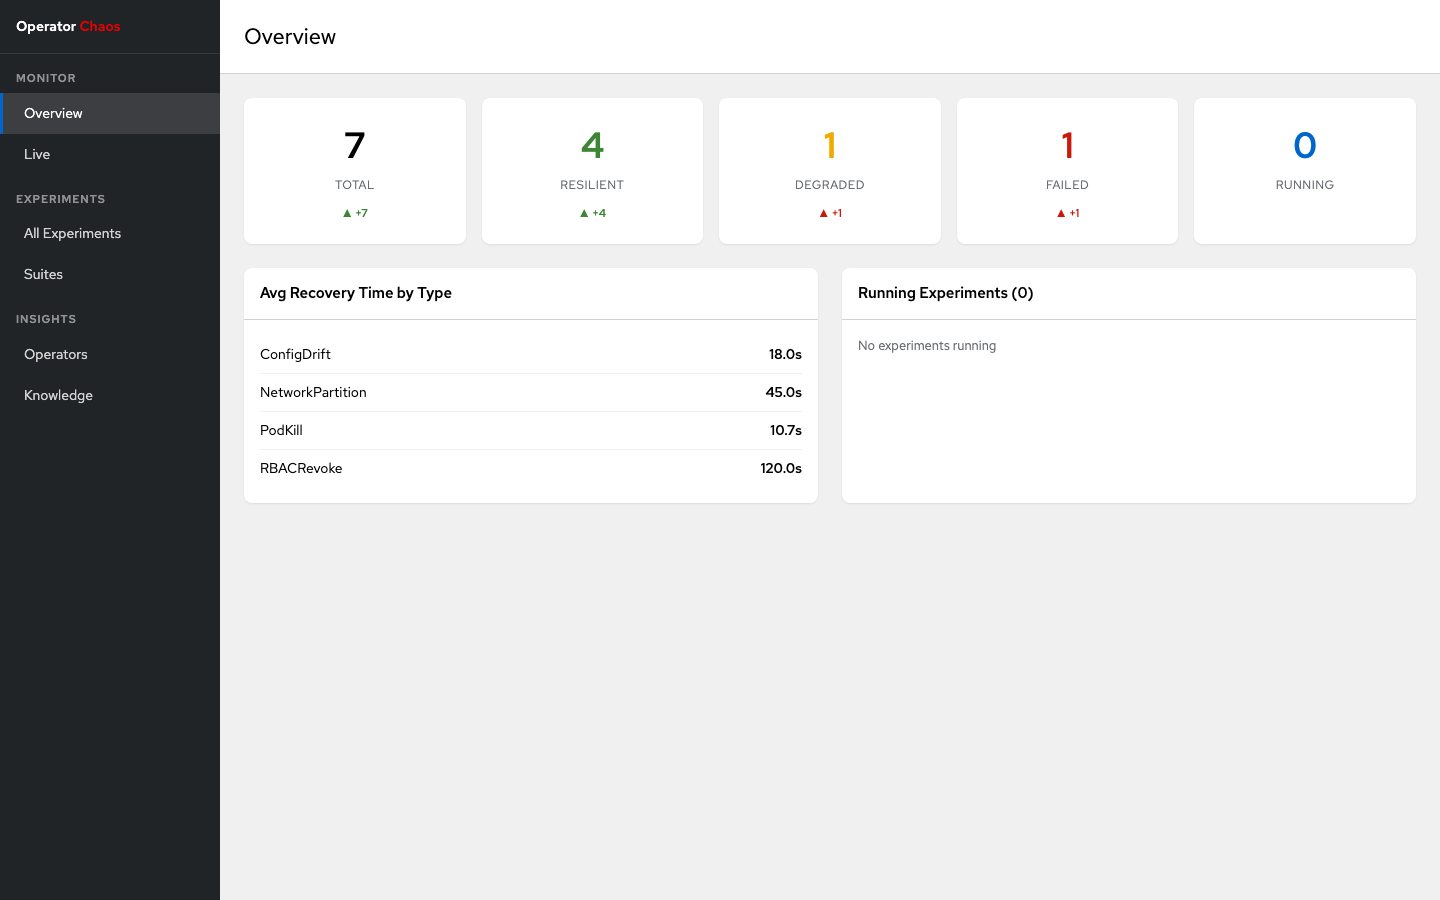
Overview (/)
Cluster-wide resilience health at a glance:
- Summary cards: Total, Resilient, Degraded, Failed, Running experiment counts
- Trend indicators: Comparison to previous period (up/down arrows with delta)
- Verdict timeline: 30-day sparkline of daily verdict counts
- Recovery metrics: Average recovery time by injection type
- Running experiments: Currently active experiments with phase and component
- Recent experiments: Latest completed experiments table
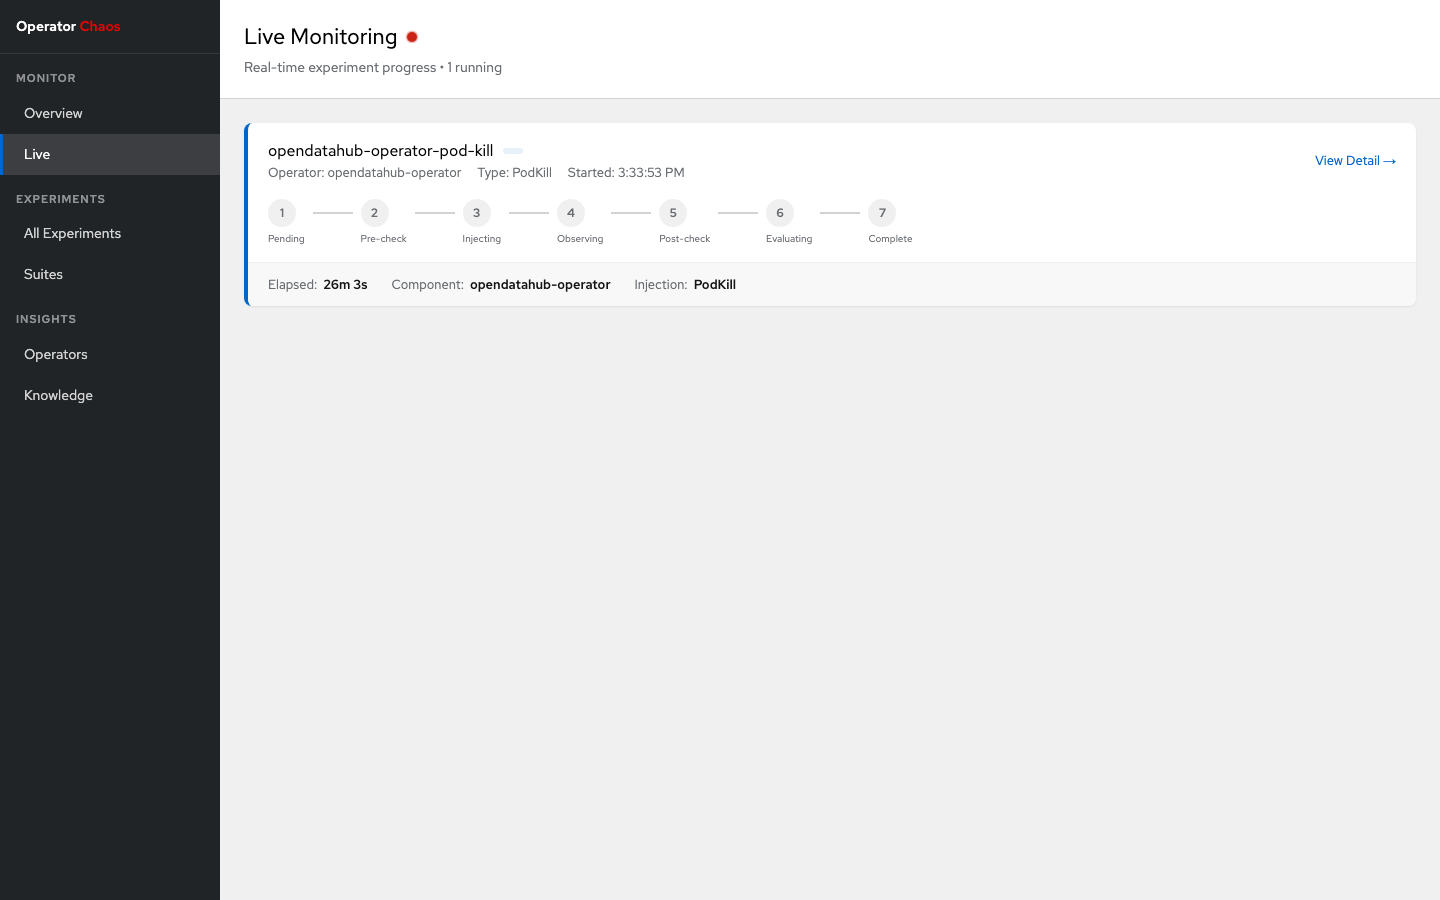
Live (/live)
Real-time monitoring of running experiments via SSE:
- Phase stepper: Horizontal dot-and-line visualization showing experiment progress through 7 phases (Pending, Pre-check, Injecting, Observing, Post-check, Evaluating, Complete)
- Active phase pulse: Blue pulsing animation on the current phase
- Aborted state: Red indicator on the phase where the experiment was aborted
- Elapsed time: Auto-updating timer showing how long the experiment has been running
- Reconnection banner: Warning when SSE connection drops, with automatic exponential backoff reconnection (1s, 2s, 4s, ... up to 30s max)
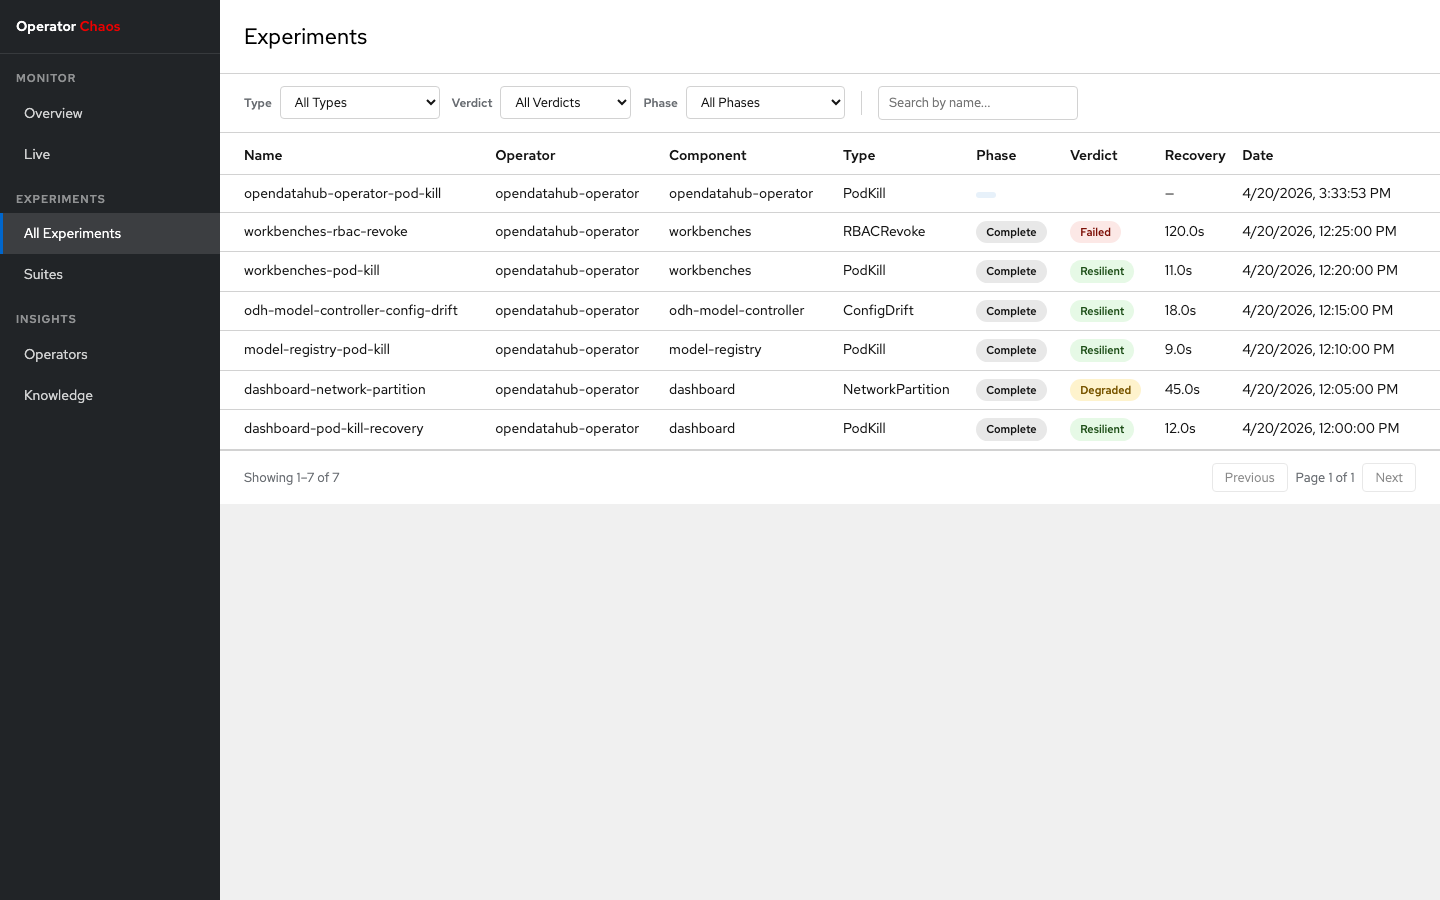
All Experiments (/experiments)
Filterable, sortable table of all experiments:
- Filters: Namespace, Operator, Component, Type, Verdict, Phase
- Search: Name substring search with 300ms debounce
- Sorting: By name, date, or recovery time (ascending/descending)
- Pagination: Configurable page size (10, 25, 50)
- Verdict badges: Color-coded badges (green=Resilient, yellow=Degraded, red=Failed, purple=Inconclusive)
Experiment Detail (/experiments/:namespace/:name)
Deep dive into a single experiment across 7 tabs:
| Tab | Content |
|---|---|
| Summary | Key-value metadata: operator, component, type, recovery time, hypothesis, blast radius |
| Evaluation | Verdict, confidence, recovery time, reconcile cycles, deviations |
| Steady State | Pre-check and post-check results with pass/fail per check |
| Injection Log | Timestamped inject/revert events with target and details |
| Conditions | Status conditions table (type, status, reason, message) |
| YAML | Full CR YAML with copy and download buttons |
| Debug | observedGeneration, cleanupError, raw status JSON |

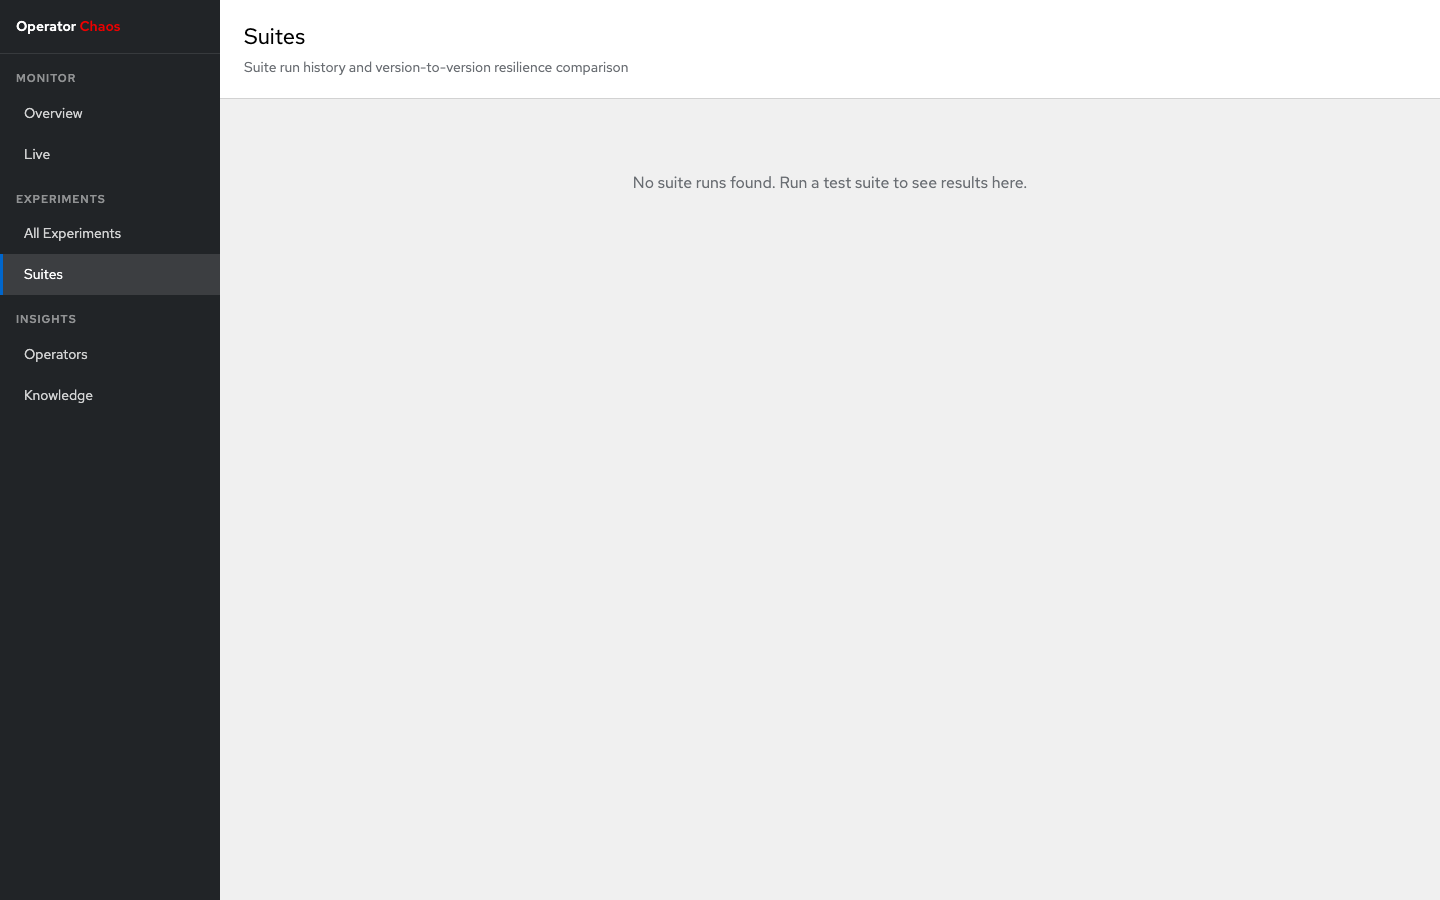
Suites (/suites)
Suite run history and version comparison:
- Suite cards: Each suite run shows name, version, experiment count, and a stacked progress bar (green/yellow/red proportional to Resilient/Degraded/Failed)
- Expandable table: Click a suite card to see its experiments with verdict and recovery time
- Version comparison: Select two runs of the same suite to compare results side-by-side with delta indicators (improved, regressed, no change)
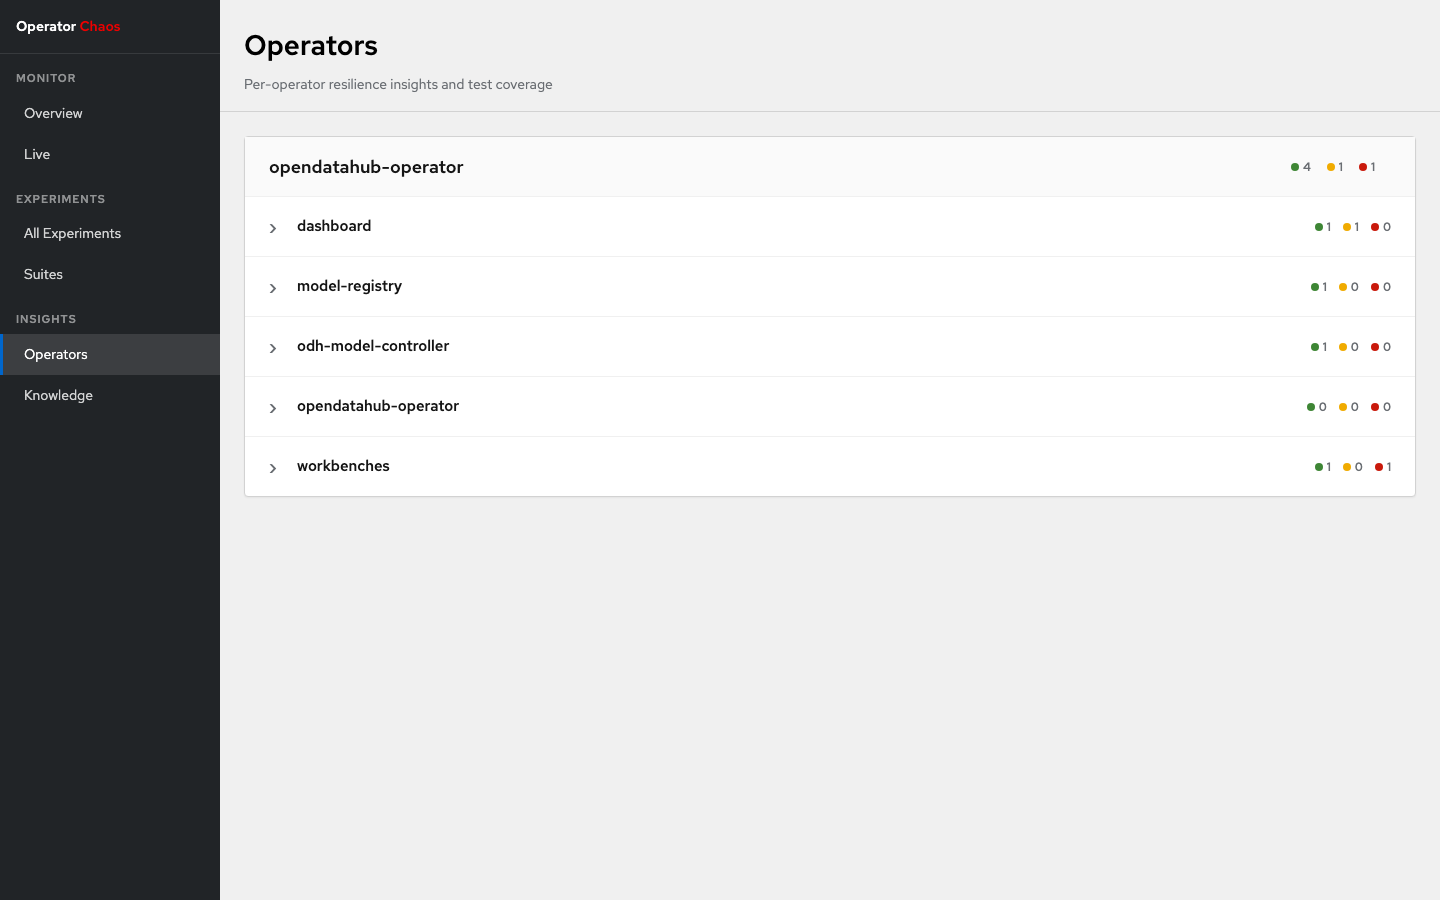
Operators (/operators)
Per-operator resilience insights:
- Operator cards: Health bar showing Resilient/Degraded/Failed proportions
- Component accordion: Expandable list of components per operator
- Coverage matrix: 11-column grid (one per injection type) showing best verdict per type (green=all Resilient, yellow=any Degraded, red=any Failed, gray=untested)
- Recent experiments: Latest 5 experiments per component with links to detail
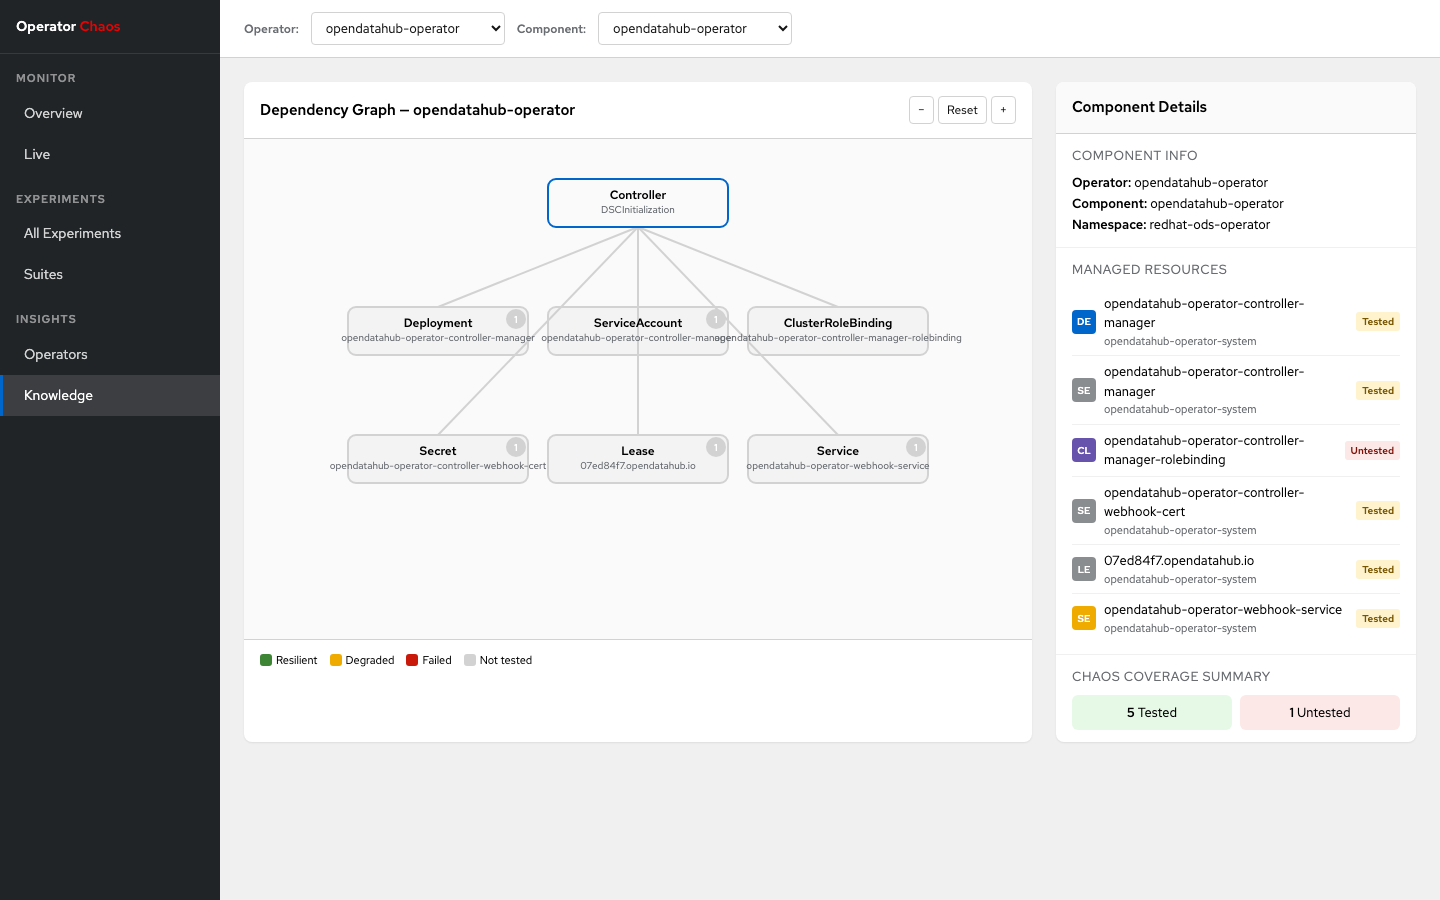
Knowledge (/knowledge)
Interactive dependency graph visualization:
- Operator/Component selectors: Dropdown toolbars to navigate the knowledge model
- SVG dependency graph: Deterministic layout with central controller node and managed resources arranged around it
- Coverage coloring: Nodes colored by chaos test coverage (green=Resilient, yellow=Degraded, red=Failed, gray=untested)
- Experiment count badges: Number of experiments run against each resource
- Detail panel: Side panel showing managed resources list, coverage tags, and chaos coverage summary
- Zoom controls: +/- buttons for graph navigation
REST API Reference
All endpoints are read-only (GET), prefixed with /api/v1/. The dashboard is strictly read-only: it cannot create, modify, or delete experiments.
Experiments
GET /api/v1/experiments
List experiments with optional filters and pagination.
| Parameter | Type | Description |
|---|---|---|
namespace |
string | Filter by namespace |
operator |
string | Filter by operator name |
component |
string | Filter by component name |
type |
string | Filter by injection type |
verdict |
string | Filter by verdict |
phase |
string | Filter by phase |
search |
string | Name substring search |
since |
string | ISO 8601 datetime or Go duration (e.g., 24h) |
sort |
string | Sort field: name, date, recovery |
order |
string | asc or desc |
page |
int | Page number (1-based) |
pageSize |
int | Items per page (default 10, max 500) |
Response:
GET /api/v1/experiments/:namespace/:name
Get a single experiment (latest run by start time).
GET /api/v1/experiments/live
SSE stream (text/event-stream). Each event is a full experiment JSON object. Events are broadcast on every status change detected by the K8s watcher.
Overview
GET /api/v1/overview/stats
Aggregated dashboard statistics.
| Parameter | Type | Description |
|---|---|---|
since |
string | ISO 8601 datetime or Go duration |
Response:
{
  "total": 30,
  "resilient": 23,
  "degraded": 4,
  "failed": 1,
  "inconclusive": 0,
  "running": 2,
  "trends": { "total": 5, "resilient": 3, "degraded": 1, "failed": -1 },
  "verdictTimeline": [{ "date": "2026-03-01", "resilient": 3, "degraded": 1, "failed": 0 }],
  "avgRecoveryByType": { "PodKill": 12000, "ConfigDrift": 28000 },
  "runningExperiments": [{ "name": "omc-podkill", "namespace": "opendatahub", "phase": "Observing", "component": "odh-model-controller", "type": "PodKill" }]
}
Operators
GET /api/v1/operators
List operator names (distinct from experiment data).
GET /api/v1/operators/:operator/components
List component names for an operator.
Knowledge
GET /api/v1/knowledge/:operator/:component
Returns the ComponentModel from the loaded knowledge YAML files. Requires -knowledge-dir to be set at startup.
Response:
{
  "name": "odh-model-controller",
  "controller": "DataScienceCluster",
  "managedResources": [
    { "apiVersion": "apps/v1", "kind": "Deployment", "name": "odh-model-controller", "namespace": "opendatahub" }
  ],
  "webhooks": [
    { "name": "validating.odh-model-controller.opendatahub.io", "type": "validating", "path": "/validate" }
  ],
  "finalizers": ["odh.inferenceservice.finalizers"]
}
Suites
Suite runs are identified by well-known labels on ChaosExperiment CRs:
| Label | Description |
|---|---|
chaos.operatorchaos.io/suite-name |
Suite definition name |
chaos.operatorchaos.io/suite-run-id |
Unique run ID |
chaos.operatorchaos.io/operator-version |
Operator version under test |
GET /api/v1/suites
List suite runs with verdict counts.
GET /api/v1/suites/:runId
List experiments in a suite run.
GET /api/v1/suites/compare?suite=X&runA=Y&runB=Z
Compare two runs of the same suite. Returns { "runA": [...], "runB": [...] }.
SQLite Database
The dashboard persists experiment data in SQLite with WAL mode for concurrent read/write access. The database is automatically created and migrated on first run.
Schema
The experiments table stores one row per experiment run, keyed by {namespace}/{name}/{startTime}. Re-running an experiment with the same name creates a new row rather than overwriting history.
Indexed columns: namespace, operator, component, verdict, phase, injection_type, start_time, suite_run_id, suite_name.
Backup
The database file is a single file at the path specified by -db. To back up:
Deployment
In-Cluster (Kubernetes)
apiVersion: apps/v1
kind: Deployment
metadata:
  name: chaos-dashboard
  namespace: opendatahub
spec:
  replicas: 1
  selector:
    matchLabels:
      app: chaos-dashboard
  template:
    metadata:
      labels:
        app: chaos-dashboard
    spec:
      serviceAccountName: chaos-dashboard
      containers:
        - name: dashboard
          image: quay.io/opendatahub/chaos-dashboard:latest
          args:
            - -addr=:8080
            - -db=/data/dashboard.db
            - -knowledge-dir=/knowledge
          ports:
            - containerPort: 8080
          volumeMounts:
            - name: data
              mountPath: /data
            - name: knowledge
              mountPath: /knowledge
      volumes:
        - name: data
          persistentVolumeClaim:
            claimName: chaos-dashboard-data
        - name: knowledge
          configMap:
            name: chaos-knowledge
---
apiVersion: v1
kind: Service
metadata:
  name: chaos-dashboard
  namespace: opendatahub
spec:
  selector:
    app: chaos-dashboard
  ports:
    - port: 8080
      targetPort: 8080
The service account needs get, list, and watch permissions on chaosexperiments.chaos.operatorchaos.io resources.
Local Development
# Terminal 1: Run the backend (proxies to Vite dev server for HMR)
go run ./dashboard/cmd/dashboard/ -knowledge-dir knowledge/

# Terminal 2: Run the Vite dev server
cd dashboard/ui && npm run dev
Configure the Vite dev server to proxy /api/ requests to the Go backend (port 8080) in vite.config.ts.
Tech Stack
| Layer | Technology |
|---|---|
| Frontend | React 18, TypeScript, Vite, Vitest + React Testing Library |
| Backend | Go, net/http, k8s.io/client-go |
| Storage | SQLite (via modernc.org/sqlite, pure Go, no CGO) |
| Build | Vite (frontend), go:embed (serve static assets) |