Dashboard (Grafana)
The Grafana dashboard provides monitoring for chaos experiments via Prometheus metrics exported by the chaos controller. It includes 9 panels tracking experiment verdicts, recovery times, injections, and deviations.
Overview
The dashboard visualizes five Prometheus metric families exposed by the chaos controller:
- Active experiment count
- Verdict distribution over time
- Injection counts by type
- Recovery time percentiles
- Reconcile cycle percentiles
- Deviation tracking by type
Prerequisites
- Grafana Operator or Grafana instance
- Prometheus with ServiceMonitor configured for the chaos controller metrics endpoint
- Chaos controller running with metrics server enabled (default:
:8080/metrics)
Installation
Deploy the dashboard via Kustomize:
This creates a GrafanaDashboard CR that the Grafana Operator will sync to your Grafana instance. If you're not using the Grafana Operator, you can manually import config/grafana/dashboard.json via the Grafana UI.
Metrics Reference
The chaos controller exposes the following Prometheus metrics:
chaosexperiment_verdicts
Type: Counter
Labels:
- verdict: Resilient, Degraded, Failed, Inconclusive
Description: Total count of experiments by verdict. Incremented when an experiment transitions to the Complete phase.
chaosexperiment_deviations
Type: Counter
Labels:
- deviation_type: The type of deviation detected during the post-check phase
Description: Total count of deviations detected across all experiments. A single experiment can contribute multiple deviations.
chaosexperiment_injections
Type: Counter
Labels:
- injection_type: PodKill, ConfigDrift, NetworkLatency, etc.
Description: Total count of injection events. Incremented when an experiment transitions to the Injecting phase.
chaosexperiment_active_experiments
Type: Gauge
Description: Number of experiments currently in a non-terminal phase (Pending, Pre-check, Injecting, Observing, Post-check, Evaluating).
chaosexperiment_recovery_seconds
Type: Histogram
Buckets: [1, 5, 10, 30, 60, 120, 300, 600, 1200, 1800]
Description: Time in seconds from injection start to recovery (post-check pass). Only recorded for experiments with a Resilient or Degraded verdict.
chaosexperiment_recovery_cycles
Type: Histogram
Buckets: [1, 2, 3, 5, 10, 20, 50, 100]
Description: Number of reconcile cycles required for recovery. Only recorded for experiments with a Resilient or Degraded verdict.
Panels
The dashboard includes 9 panels arranged in a 3-row grid:
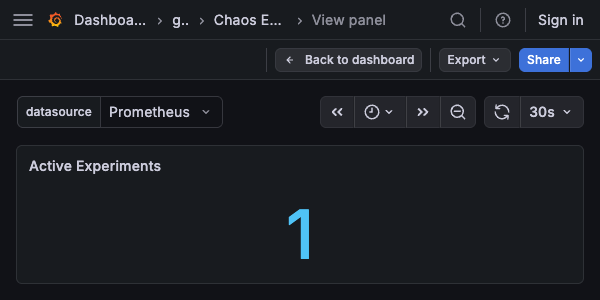
Active Experiments
Type: Stat
Query:
Description: Current count of running experiments. Shows the last non-null value.
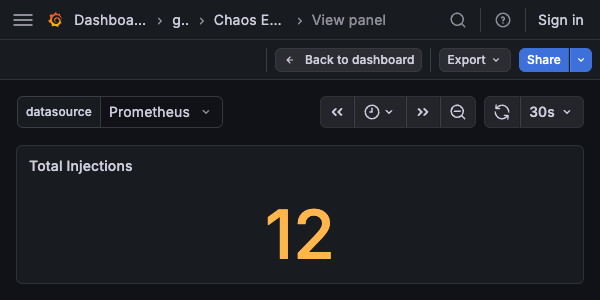
Total Injections
Type: Stat
Query:
Description: Total injection count across all experiments. Shows the last non-null value.
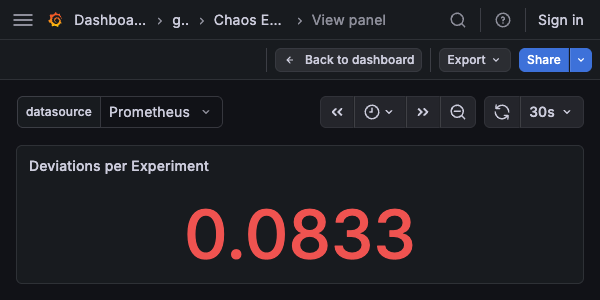
Deviations per Experiment
Type: Stat
Query:
Description: Average number of deviations per experiment. Shows - if no experiments have completed.
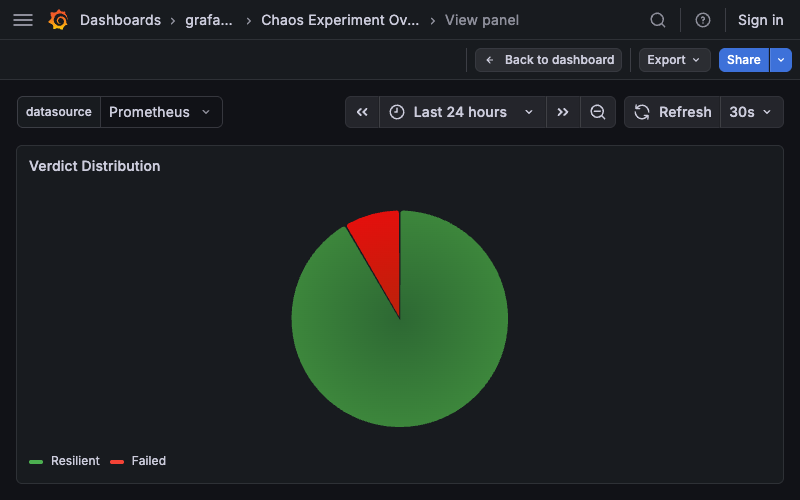
Verdict Distribution
Type: Pie chart
Query:
Description: Proportion of experiments by verdict (Resilient, Degraded, Failed, Inconclusive). Legend shows verdict labels. Color overrides: - Resilient: green (#4caf50) - Degraded: orange (#ff9800) - Failed: red (#f44336) - Inconclusive: gray (#9e9e9e)
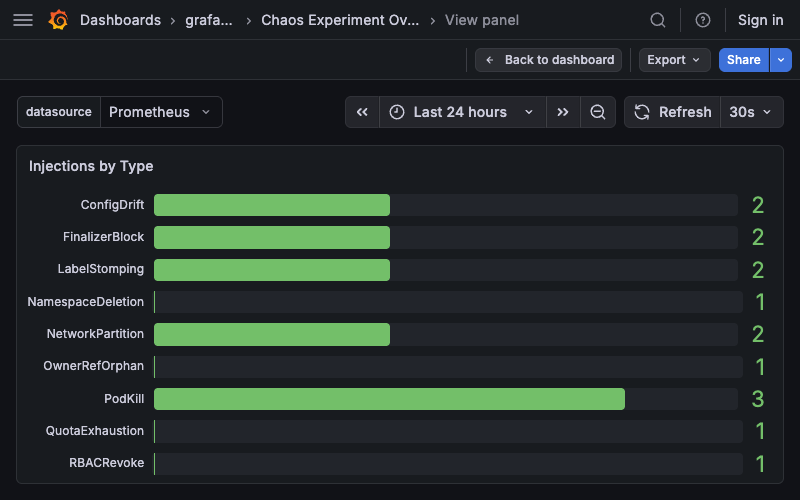
Injections by Type
Type: Bar gauge (horizontal)
Query:
Description: Total injections grouped by type (PodKill, ConfigDrift, etc.). Bars show gradient fill with unfilled track.
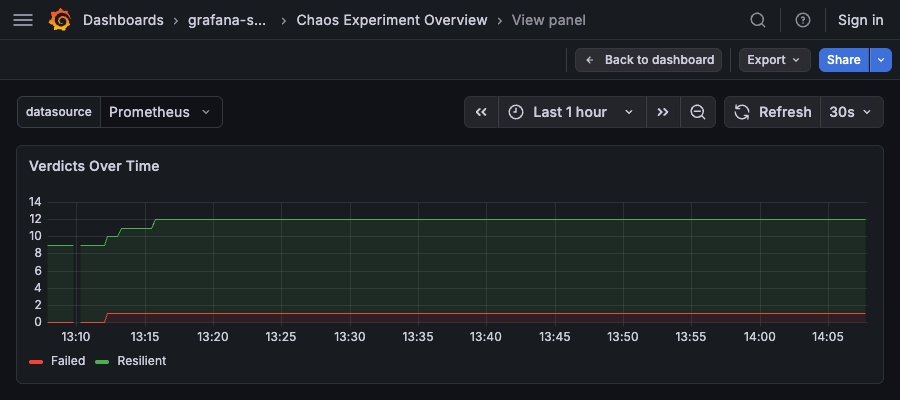
Verdicts Over Time
Type: Time series (stacked area)
Query:
Description: Stacked area chart showing verdict counts over time. Uses the same color overrides as the pie chart. Stacking mode: normal.
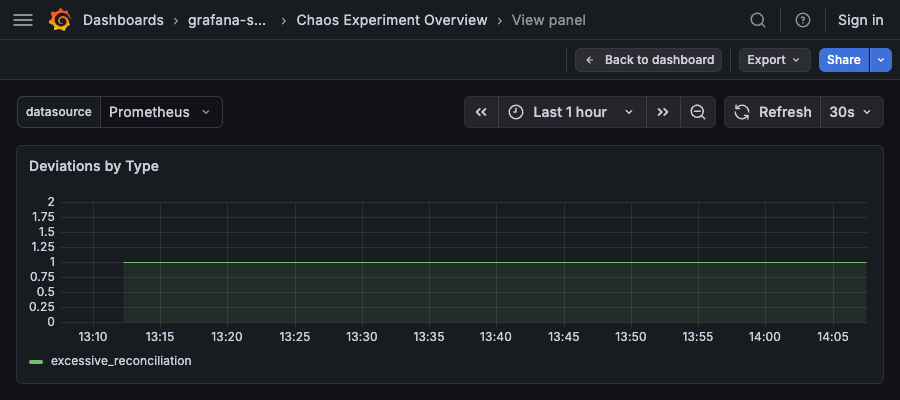
Deviations by Type
Type: Time series (stacked area)
Query:
Description: Stacked area chart showing deviation counts over time, grouped by type.
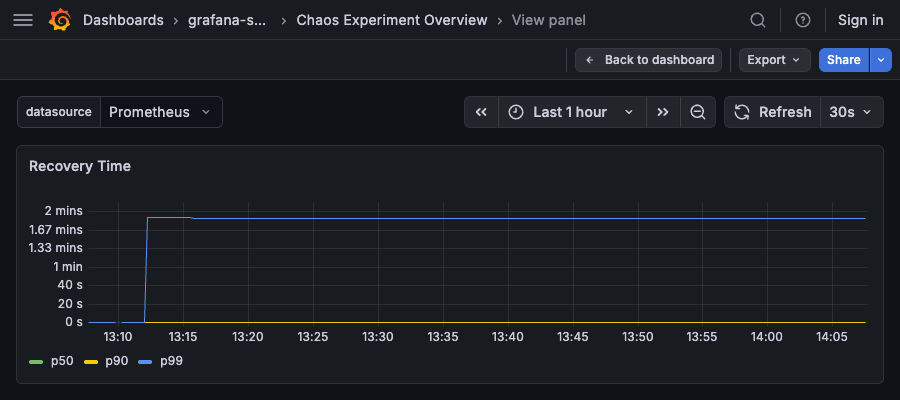
Recovery Time
Type: Time series
Queries:
# p50
histogram_quantile(0.50, sum by (le)(chaosexperiment_recovery_seconds_bucket))

# p90
histogram_quantile(0.90, sum by (le)(chaosexperiment_recovery_seconds_bucket))

# p99
histogram_quantile(0.99, sum by (le)(chaosexperiment_recovery_seconds_bucket))
Description: Recovery time percentiles (p50, p90, p99) in seconds. Shows how long it takes for operators to recover from chaos injections.
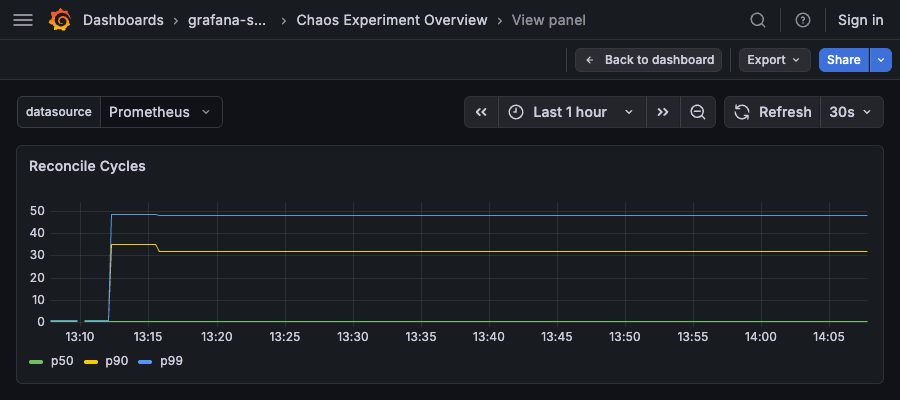
Reconcile Cycles
Type: Time series
Queries:
# p50
histogram_quantile(0.50, sum by (le)(chaosexperiment_recovery_cycles_bucket))

# p90
histogram_quantile(0.90, sum by (le)(chaosexperiment_recovery_cycles_bucket))

# p99
histogram_quantile(0.99, sum by (le)(chaosexperiment_recovery_cycles_bucket))
Description: Reconcile cycle percentiles (p50, p90, p99). Shows how many reconciliation loops are required for recovery.
Alerting Examples
Sample Prometheus alerting rules based on the metrics:
groups:
  - name: chaos_experiments
    interval: 1m
    rules:
      - alert: HighFailureRate
        expr: |
          sum(rate(chaosexperiment_verdicts{verdict="Failed"}[1h])) /
          sum(rate(chaosexperiment_verdicts[1h])) > 0.2
        for: 10m
        labels:
          severity: warning
        annotations:
          summary: "Chaos experiment failure rate above 20%"
          description: "{{ $value | humanizePercentage }} of experiments failed in the last hour"

      - alert: SlowRecovery
        expr: |
          histogram_quantile(0.90,
            sum by (le)(rate(chaosexperiment_recovery_seconds_bucket[1h]))
          ) > 300
        for: 15m
        labels:
          severity: warning
        annotations:
          summary: "90th percentile recovery time exceeds 5 minutes"
          description: "p90 recovery time is {{ $value | humanizeDuration }}"

      - alert: HighDeviationRate
        expr: |
          sum(rate(chaosexperiment_deviations[1h])) /
          sum(rate(chaosexperiment_verdicts[1h])) > 3
        for: 10m
        labels:
          severity: info
        annotations:
          summary: "High deviation rate detected"
          description: "Average {{ $value | humanize }} deviations per experiment"

      - alert: StaleExperiments
        expr: chaosexperiment_active_experiments > 0
        for: 2h
        labels:
          severity: warning
        annotations:
          summary: "Experiments stuck in non-terminal phase"
          description: "{{ $value }} experiments have been running for over 2 hours"
Customization
To modify the dashboard:
- Edit
config/grafana/dashboard.jsondirectly - Or import into Grafana UI, make changes, and export back to JSON
Adding Panels
When adding new panels, ensure you:
- Set
datasource.uidto${datasource}(uses the dashboard variable) - Place in the
panelsarray with appropriategridPos(h/w/x/y) - Assign a unique
id(current max is 9)
Recording Rules
For high-cardinality queries (e.g., per-component recovery time), consider using Prometheus recording rules:
groups:
  - name: chaos_recording_rules
    interval: 1m
    rules:
      - record: chaos:recovery_seconds:p90
        expr: |
          histogram_quantile(0.90,
            sum by (le, component)(rate(chaosexperiment_recovery_seconds_bucket[5m]))
          )

      - record: chaos:verdict_rate:1h
        expr: |
          sum by (verdict)(rate(chaosexperiment_verdicts[1h]))
Then reference the recorded metrics in the dashboard to improve query performance.